
Drainage basins and flooding
Drainage basins

Source: http://www.bbc.co.uk/schools/gcsebitesize/geography/water_rivers/background_rivers_rev2.shtml

Source: http://greenfieldgeography.wikispaces.com/Drainage+basins

Source: https://prezi.com/9cvqkugz43am/elements-of-the-drainage-basin-systems/
Feedback Loops: A system is always trying to maintain a balance (equilibrium). Feedback loops explain when a system (drainage basin) loses and attempts to regain its balance. Positive feedback causes an instability by changing inputs (increase in precipitation). Negative feedback attempts to regain the equilibrium by reducing inputs or possibly increasing outputs. Humans can alter feedback loops by changing the amount of water released from dams, changing the amount of water used or even increasing run-off through deforestation.
Source: http://greenfieldgeography.wikispaces.com/Drainage+basins
Negative and positive feedback systems keep a system in dynamic equilibrium. A negative feedback decreases the amount of change by reducing some of the inputs, returning the system to stability. Positive feedback is less common. It increases the amount of change. This leads to an imbalance.

Source: http://www.geographyalltheway.com/in/ib-freshwater/drainage-basins-tasks.htm
Discharge
In hydrology, discharge is the volume rate of water flow (velocity), which is transported through a given cross-sectional area.
Discharge is normally measured in cumecs (cubic metres a second).
Source: http://www.thegeographeronline.net/freshwater---issues-and-conflicts.html
Bed: The bottom of the river channel
Bank: The sides of the river channel.
Channel: The confines of the river, encompassing the bed and two banks.
Wetted Perimeter: The total length of the bed and the banks in contact with the river.
Cross-sectional area: The width of the river multiplied by the depth of the river. Because the depth of the river will vary across its width, an average depth reading is normally taken. The cross sectional area is normally given in m2.
Velocity: This is the speed that the water in a river is travelling at. The unit of measurement is normally metres a second (m/s). River velocity can be measured using a flowmeter (pictured right), or more commonly by timing a floating object over a set distance (pictured left). Velocity is then calculated by dividing the time (seconds) by the distance (metres).
Discharge: This is the amount of water in a river at a given point. Discharge is normally measured in cumecs (cubic metres a second). It is calculated by multiplying the cross-sectional area by the velocity.
As you move from the source to the mouth, both the discharge and velocity of a river increases.
Source: http://greenfieldgeography.wikispaces.com/Discharge
Source: http://www.thegeographeronline.net/freshwater---issues-and-conflicts.html
Source: http://greenfieldgeography.wikispaces.com/Discharge
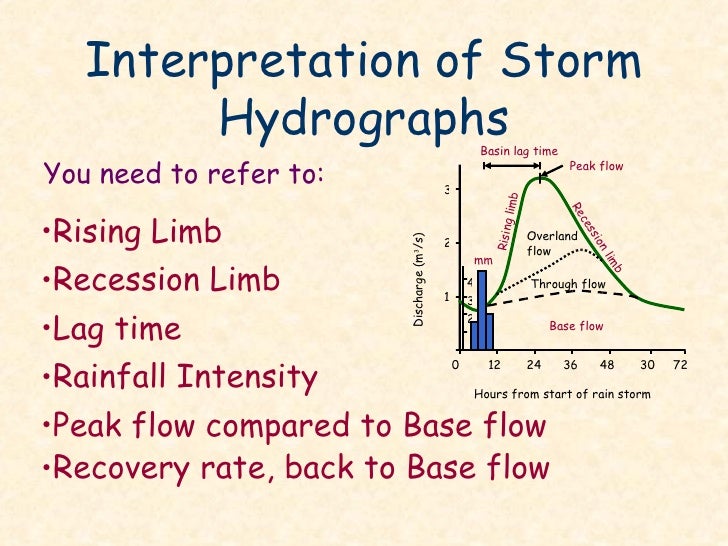
Hydrographs
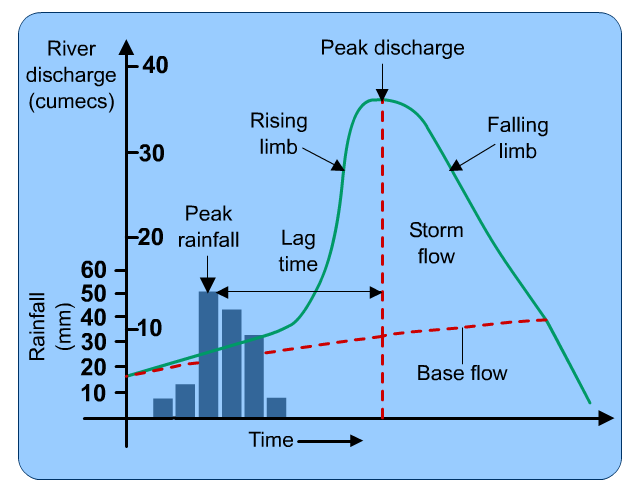
A hydrograph or storm hydrograph is a type of graph that shows how a rivers' discharge responds to a period of precipitation. Discharge is measured in one point (using the units cumecs), but precipitation is measured over the whole drainage basin. On the hydrograph, precipitation is shown using a bar graph and discharge is shown using a line graph.
Peak rainfall: The highest rainfall (usually measured in mm) during a storm.
Peak discharge: The highest discharge as a result of a storm event.
Lag time: The period of time between peak rainfall and peak discharge
Response time: The time between the first rain falling and the first change in discharge.
Rising limb: The period of time that the river is experiencing an increase in discharge.
Falling or recessional limb: The period of time that a rivers' discharge is falling after a storm event and returning to its normal flow.
Bankfull discharge: The maximum amount of discharge that a river can hold before it burst its banks and floods.
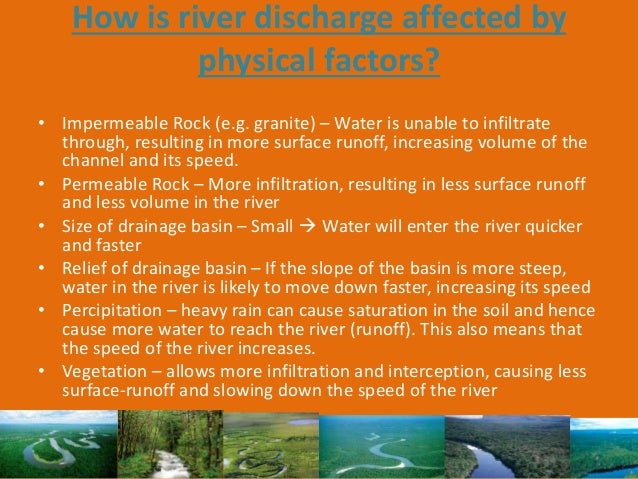
As the period from the initial storm increases, throughflow and baseflow will become increasingly more important in contributing to a rivers' discharge. Initially surface run-off will be the most important factor in contributing to a rivers' discharge because this is the quickest way for rainfall to enter a river.
Source: http://greenfieldgeography.wikispaces.com/Hydrographs
Source: http://www.thegeographeronline.net/freshwater---issues-and-conflicts.html
Source: http://www.thegeographeronline.net/freshwater---issues-and-conflicts.html
The hydrograph below illustrates two storm hydrographs for the same rainfall event in two areas of contrasting land use.

Source: http://www.geographyalltheway.com/in/ib-freshwater/hydrographs.htm
Floods
Rio de janeiro 2011
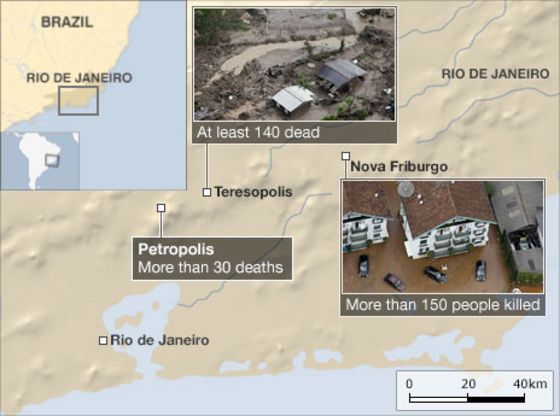
Source: http://www.bbc.com/news/world-latin-america-12180079
Source: http://greenfieldgeography.wikispaces.com/Floods
No comments:
Post a Comment