
Characteristics of hazards
When investigating hazards one must distinguish them in terms of:
- spatial extent
- predictability
- frequency
- magnitude
- duration
- speed of onset
- effects
Source: Diploma programme Geography guide.
Duration: The length of time that a hazard lasts for. As a general rule the longer the hazard the more severe it is likely to be. For example and earthquake that lasts 1 minute is likely to be more severe than one that last two seconds and a drought that lasts ten years is likely to be more severe than one that last three months.
Magnitude: This is the strength of a hazard. Most hazards are measured on a scale e.g. the Richter scale or the volcanic explosivity index (VEI). Generally speaking, the stronger the hazard the more severe the hazard is.
Predictability: Some hazards are easier to predict than others. For example, volcanoes normally give warning signs before they erupt and tropical storms can be tracked from development to landfall. However, others like earthquakes are much harder to predict. Generally speaking hazards that hit with no warning are going to be more serious.
Regularity: If hazards happen often and in quick succession e.g. a earthquake followed by multiple aftershocks then then the severity is likely to be greater. During hurricane seasons, countries can be hit by repeated storms each causing greater damage because it has not been possible to recover from previous damage.
Frequency: The return interval of hazards of certain sizes. For example earthquakes with a magnitude of over 8.0 happen on average once a year, but earthquakes of only 3 or 4 happen many times a day. If the hazard is a less frequent strong event, then it is going to have a bigger impact.
Speed of onset: If the peak of the hazard arrives first or arrives quickly e.g. an earthquake, then the effects are likely to be worse than one that arrives slowly e.g. a drought.
Spatial concentration: Where hazards are located or centred. For example earthquakes tended to be focused along plate boundaries, whereas tropical storms tend to be located in coastal areas in the tropics. Hazards that are located in known areas can be better prepared for and managed better.
Areal extent: If a hazard covers a large area e.g. a drought covering the whole of East Africa, then the severity of the hazard is likely to be more severe, than a flood hitting just one village.
Number of hazards: If a location is hit by multiple hazards that the affects can be more severe. For example hazard hotspots like Indonesia can be hit by earthquakes, volcanoes, landslides and flooding all simultaneously.
Source: http://greenfieldgeography.wikispaces.com/Characteristics
Classifications
1. Physical
- Earthquakes
- Volcanoes
- Tsunami
- Tornadoes
- Hurricanes
- Meteor strike
1. Human
- Nuclear accident
- Gas explosion
- Car accident
- Chemical leak
1. Combination or either
- Acid rain
- Forest fires
- Landslides
- Avalanches
- Drought
- Global warming
1. Biological
- HIV/AIDS
- Malaria
- Animal attacks
2. Geophysical - climate and meteorological
- Droughts
- Floods
- Heatwaves
- Tornadoes
- Hurricanes
2. Geophysical - geological and geomorphological
- Earthquakes
- Volcanoes
- Mass movements
- Tsunami
2. Biological - floral
- Hayfever
- Plant infestations
- Poisonous plants
- Fungal diseases
2. Biological - faunal
- Animal attacks
- Bacterial and viral diseases
- Animal infestations
Source: http://greenfieldgeography.wikispaces.com/Characteristics
Earthquakes

Source: http://www.bbc.co.uk/schools/gcsebitesize/geography/natural_hazards/earthquakes_rev1.shtml
Epicentre: The location on the earth's surface directly above the hypocentre.
Hypocentre (focus): The actual site/location that an earthquake takes place.
Aftershock: A smaller earthquake that takes place in the coming hours, days and weeks after the main earthquake.
Seismic Waves: These are waves of energy that travel through the earth as a result of an earthquake. There are two types of waves; body waves that travel through the earth and can be divided into p-waves (more longitudinal) and s-waves (more transverse) and surface waves that travel across the surface.
Tremor: A tremor is another name for an earthquake, but is all sometimes the name given to a lesser earthquake or the felt effects of a big earthquake by people living further from the epicentre.
Source: http://greenfieldgeography.wikispaces.com/Earthquakes+and+Volcanoes

Source: http://lypahozemo.hostoi.com/earthquake-map-prediction.php
The following are elements of an earthquake hazard:
- Time of earthquake
- Date of earthquake
- Exact location of epicentre
- Fault upon which the quake occurs
- The magnitude of the earthquake
- The economic impact of the earthquake
- The death toll of the earthquake
Source: http://slideplayer.com/slide/685326/

Source: https://www.scec.org/research/focusareas/EFP/scec3.html

Source: http://peter-mulroy.squarespace.com/how-do-we-measure-earthquake-strength/
Magnitude Average Annually
8 and higher 1 ¹
7 - 7.9 17 ²
6 - 6.9 134 ²
5 - 5.9 1319 ²
4 - 4.9 13,000
(estimated)
3 - 3.9 130,000
(estimated)
2 - 2.9 1,300,000
(estimated)
¹ Based on observations since 1900.
² Based on observations since 1990.
Source: http://www.geographyalltheway.com/in/ib-hazards/earthquakes-overview.htm
Volcanoes

Source: http://greenfieldgeography.wikispaces.com/IGCSE+Plate+Tectonics+and+GCSE+Plate+Tectonics
Lava: Molten rock above the surface of the earth.
Magma: Molten rock below the surface of the earth.
Magma Chamber: A store of magma found below the surface of the earth. When the pressure becomes to great in the magma chamber, volcanoes occur.
Vent: The main passage by which magma travels from the magma chamber to the crater. You can also get smaller secondary vents that often split off from the main vent.
Crater: A large hole or depression that has been created by a volcano. Lakes will often form in the bottom of lakes, they are known as crater lakes.
Eruption: A release of volcanic lava, ash or gas.
Active volcano: A volcano that regularly erupts and has erupted in recent history.
Dormant volcano: A volcano that has not erupted recently, but may erupt again in the future. It is unclear how long a volcano has to be dormant, before it is classified as dormant.
Extinct volcano: A volcano that will not erupt again in the future. It is unclear when an active or dormant volcano becomes extinct. Some people argue its is extinct if there is no reordered eruptions, others if it has not erupted for 10,000 years.

Source: http://greenfieldgeography.wikispaces.com/Earthquakes+and+Volcanoes
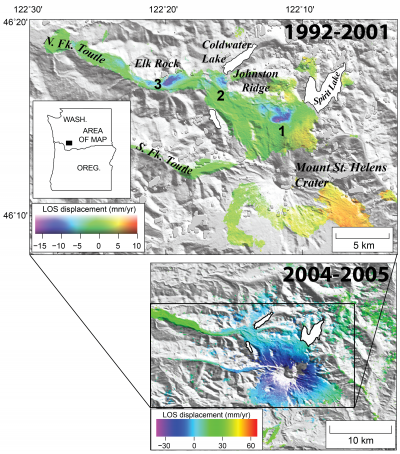
Comprehensive monitoring provides timely warnings of volcano reawakening
Monitoring a volcano requires scientists to use of a variety of techniques that can hear and see activity inside a volcano. The USGS Volcano Hazards Program monitors volcanoes to detect signs of change that forewarn of volcanic reawakening. To fully understand a volcano's behavior, monitoring should include several types of observations (earthquakes, ground movement, volcanic gas, rock chemistry, water chemistry, remote satellite analysis) on a continuous or near-real-time basis.

Broad networks of many instruments result in a more complete picture of volcanic activity.
Scientists collect data from the instrument networks then analyze them to look for out-of-the-ordinary signals. By comparing the data analysis with similar results from past volcanic events, volcanologists are better able to forecast changes in volcanic activity and determine whether and when a volcano might erupt in the future. Most data can be accessed from our offices in the observatories but visits to the volcanoes, when possible, add valuable information.
Early detection of unrest with sensitive monitoring instruments helps reduce socioeconomic loss.
Rapid advances in technology are helping scientists develop efficient and accurate monitoring equipment. These new systems are capable of collecting and transmitting accurate real-time data from the volcano back to Observatory offices, which improves eruption forecasting. It is important that instruments be installed during quiet times when volcanoes are not active so that they are ready to detect the slightest bit of volcanic stirring. Early detection gives the maximum amount of time for people to prepare for an eruption.
Monitoring data help forecast the course of an eruption once unrest is detected.
When a volcano begins showing new or unusual signs of activity, monitoring data help answer critical questions necessary for assessing and then communicating timely information about volcanic hazards. For example, prior to the 2004 eruption at Mount St. Helens monitoring equipment recorded a large increase in earthquake activity. Scientists quickly examined other monitoring data including gas, ground deformation, and satellite imagery to assess if magma or fluid was moving towards the surface. Based on the history of the volcano and the analysis of the monitoring data scientists were able to determine the types of magma could be moving towards the surface. This type of knowledge helps scientists figure out the possible types of volcanic activity and the associated hazards to people. Knowing the hazards helps officials determine which real-time warnings are needed to prevent loss of life and property.
Source: https://volcanoes.usgs.gov/vhp/monitoring.html
FREQUENCY AND SIZE
There are about 550 volanoes on earth that have erupted in historic times. Such volcanoes are considered to be geologically active (see: What is an "active" volcano?). In addition, there are an equivalent number of dormant volcanoes that have not erupted in historic time, but have erupted in the past 10,000 years. Both dormat and "active" volcanoes have the potential to erupt again. On any given day, there are about ten volcanoes that are actively erupting.
Eruptions are highly variable in size and explosiveness. As the table below demonstrates, small eruptions are more frequent than larger eruptions. It takes a greater amount of time to build up the necessary gas pressures needed for the larger eruptions. The global frequency of small eruptions, producing 0.001 to .01 cubic kilometers of volcanic material, is once every few months, whereas the frequency of very large eruptions, producing thousands of cubic kilometers of ash, is about once every 100,000 years. The last truly giant eruption on earth occurred at the Toba volcano on Sumatra 74,000 years ago. It produced ~2,800 cubic kilometers of ash, more than 2000 times the amount generated by the 1980 eruption of Mt. St. Helens!
Source: http://www.geology.sdsu.edu/how_volcanoes_work/Variability.html
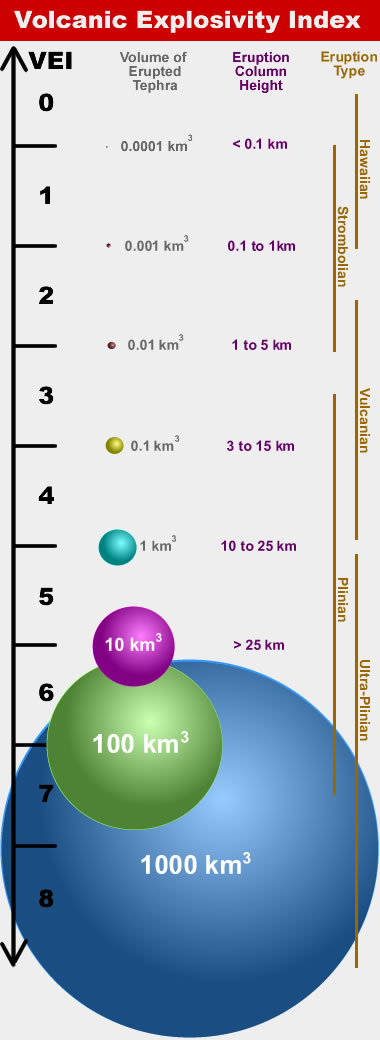
Measuring Explosive Eruptions
Chris Newhall of the United States Geological Survey and Stephen Self of the University of Hawaii developed the Volcanic Explosivity Index (VEI) in 1982. It is a relative scale that enables explosive volcanic eruptions to be compared with one another. It is very valuable because it can be used for both recent eruptions that scientists have witnessed and historic eruptions that happened thousands to millions of years ago.
The primary eruption characteristic used to determine the volcanic explosivity index is the volume of pyroclastic material ejected by the volcano. Pyroclastic material includes volcanic ash, tephra, pyroclastic flows, and other types of ejecta. The height of the eruption column and the duration of the eruption are also considered in assigning a VEI level to an eruption.
Source: http://geology.com/stories/13/volcanic-explosivity-index/
The effects of volcanic eruptions
The effects of volcanic eruptions can be divided into primary and secondary effects. The primary effects are immediate and come from the eruption itself whereas the secondary effects result from the primary effects.

Primary effects of a volcanic eruption
Volcanic gases - All magma contains dissolved gases that are release during and between eruptions. These gases are mainly steam, carbon dioxide and compounds of sulphur and chlorine.
Lava flows - These are streams of molten rock.
Pyroclastic flows - These are high speed avalanches of hot ash, rock fragments and gas which move down the sides of a volcano. These flows occur when the vent area or ash column collapses.
Tephra - The explosive power of an eruption causes old lava to be blasted into tiny pieces and hurled into the air. The fragments are tephra.
Secondary effects of a volcanic eruption
Lahars - These are mixtures of water, rock, ash, sand and mud that originate from the slopes of a volcano. Lahars often happen because of heavy rainfall eroding volcanic deposits or heat from a volcanic vent suddenly melting snow and ice.
Landslides - Heat from cooling magma can cause hydrothermal alteraton of the rocks, turning sections of them into clay. This weakens the rocks and increases the risk of slope failures.
Flooding - Explosive eruptions can change thge surface areas around a volcano and disrupt drainage patterns, leading to long-term flooding.
Other secondary effects include:
Food / water supply interrupted.
Homelessness.
Businesses forced to close.
Cost of insurance claims.
Unemployment.
Long-term issues with the tourism industry.
Source: http://worldlywise.pbworks.com/w/page/25833576/Unit%202%20Section%20B%20-%20Causes%20and%20effects%20of%20volcanoes%20and%20responses%20to%20them
Hurricanes (tropical cyclones, typhoons)

Source: http://www.ucar.edu/news/features/hurricanes/htc_desc.htm
A hurricane is a large low pressure system characterised by high winds and heavy rain. Hurricanes are also known as typhoons in East and South-east Asia and cyclones around the Indian Ocean. To be classified as a hurricane, winds must exceed 119km/hr (74 mph). Small low pressure systems are called tropical storms (63-118km/hr) and tropical depressions (0-62km/hr).
Hurricane Formation and Location of Hurricanes
Hurricanes are intense low pressure systems that develop over warm tropical seas. Because hurricanes form at sea and are extremely dangerous, there development is not fully understood. What is known is that they gain their energy from warm water. The conditions needed for hurricanes to develop are:
Warm waters. At least 27 degrees centigrade to a depth of 60 metres.
The low pressure has to be sufficiently further enough away from the equator for the Coriolis force to create a hurricanes circular motion.
There has to be low pressure systems (depressions) that have the potential to grow. Less than 10% of tropical disturbances turn into hurricanes.
Hurricanes can turn into massive systems up to 800km wide, but the intense storm around the eye rarely exceeds 300km. Because hurricanes need warm water to develop they normally occur towards the end of the summer. Hurricanes are associated with very intense winds and heavy rainfall. The winds are generated by the difference in pressure between the eye (very low pressure) and the edge of hurricane (higher pressure). The high winds and heavy rainfall can also create a number of secondary hazards like storm surges, flooding and landlsides.
Because of the conditions needed for storms to develop (warm seas) it means that storms are only found in warm tropical areas - ideally over warm shallow seas like the Caribbean. Once hurricanes hit land, they lose their source of energy and lose their strength very quickly.
Source: http://greenfieldgeography.wikispaces.com/Hurricanes

Source: https://en.wikipedia.org/wiki/Tropical_cyclone
The Eye: The centre of a hurricane is called the eye. As the eye moves overhead conditions can turn temporarily calm.
Landfall: The location that the storm hits the coast (land).
Formation: The location a hurricane is created.
Dissipation: Where a hurricane breaks up and loses strength.
Primary Hazards
Wind: Hurricanes are associated with strong winds. To be classified as a hurricane wind speed has to exceed 74mph (119 km/hr)
Rain: Because hurricanes suck up large amount of energy and moisture from the sea, they are associated with intense rainfall, up to 500mm in 24hours.
Secondary Hazards
Landslides: Because hurricanes bring very intense rainfall, they can cause hillsides to become saturated very quickly increasing the stress on them and the likelihood of landslides.
Flooding: The intense rainfall can also cause severe flooding. The rainfall may also be combined with a storm surge making the flooding worse.
Storm Surges and Heavy Seas: Because of the friction between the wind and the surface of the water, large waves can be created. Also the hurricane can literally drag water in land, causing coastal flooding. Storm surges can be especially bad if they coincide with high tides (especially spring tides).
Source: http://greenfieldgeography.wikispaces.com/Hurricanes

Source: http://earthsci.org/processes/weather/Larry_data/bom_larry/Tropical%20Cyclone%20Larry.htm
Although hurricanes are very hard to predict and track, scientists gaining a better understanding so can never give more accurate warnings. To begin with scientists know the conditions necessary for hurricanes to form, namely warm water. Therefore they know that hurricanes are likely to form in tropical areas towards the end of summer e.g. in the Caribbean between June and November. They also know that hurricanes normally move westwards (because of easterly winds) and slightly towards the poles (see map to the right). Even though scientists can not say exactly when a hurricane will form, because they form at sea they can make attempts to predict the path of hurricanes so that they can predict landfall and therefore warn communities. Hurricane tracks are predicted in a number of ways, by attempting to measure; temperature (air and sea), pressure, wind speed/direction and moisture:
Satellites: Satellites are now much more sophisticated and can measure the size of hurricanes, the direction they are travelling, but also cloud structure and ocean temperatures.
Weather radar: The US has a total of 155 radars constantly scanning the skies over the US and its surrounds. They are capable of recording wind and precipitation data.
Aircraft: The US Air Force uses aircraft to drop sensors into hurricanes to measure wind speed, wind direction, pressure, etc.
Buoys and floats: These can measure water and air temperature, wave height and the direction and speed of wind.
Computer models: All the information that is collected from the four methods above is then fed into computers to try and predict future movements and changes of hurricanes. However, even with improved data, models can often pick very varied courses and changes of hurricanes. To the right is a map showing the different computer predictions for Hurricane Katrina - you can see the predicted tracks are very varied.

Source: http://greenfieldgeography.wikispaces.com/Hazard+event+prediction

Source: http://policlimate.com/tropical/
Droughts

Source: http://www.safehaven.com/article/30085/ghost-empire

Source: http://www.climatecodered.org/2012/07/climate-news_30.html
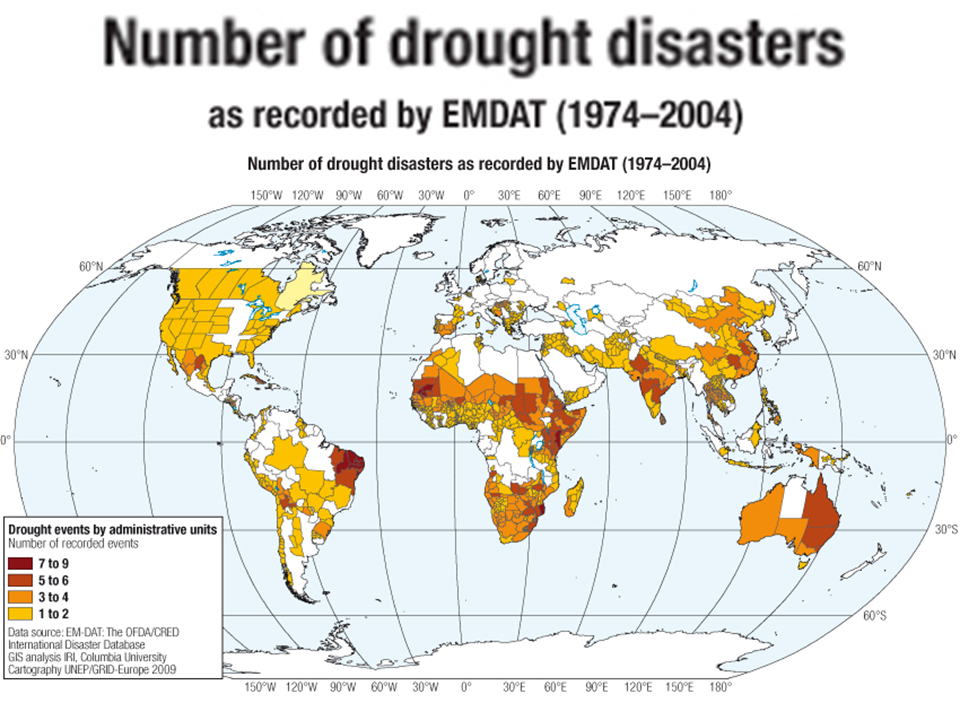
Because a drought is a prolonged period where the demand for water exceeds supply (water stress) then droughts can technically happen anywhere in the world. However, the most severe droughts tend to be located in certain areas of the world (shown in red on the map to the right) including:
Australia
Brazil
The Sahel (north Africa just below the the Sahara desert)
China and India
Parts of the US and Mexico and Southern Africa also suffer from droughts. The causes of droughts might not always be the same. North Africa and the Arabian peninsula are very arid, but because of the low population densities they don't suffer from regular droughts. Australia normally suffers droughts because of physical water scarcity (shortage of rain), whereas Brazil, India and China are more likely to suffer from economic water scarcity.
Some droughts may only last one season, but some like the ongoing drought in East African can last many years.
Key Terminology and Hazards
Arid: Arid means extremely dry, lack of moisture.
Desert: An arid area with very low levels of precipitation, making it impossible to support large amounts of vegetation, animals or people. Antarctica is technically a desert because of its low precipitation rates. The Sahara Desert is the largest traditional desert.
Water stress: When the demand for water exceeds the supply of water and shortages exist.
Physical Water Scarcity: When the supply of rainfall is lower than the demand of water.
Economic Water Scarcity: When water supplies exist, but the local population can not access them because of pollution, lack of technology, etc.
Hazards and Problems
Famine: Drought can lead to crop failures and livestock deaths that can lead to undernourishment and famine (food shortages).
Biodiversity Loss: Drought can cause plants and animals to die. Animals that drink large quantities of water like elephants can be some of the first to die.
Conflict: As water supplies begin to reduce then conflict over the remaining sources intensifies. This can be particular severe if resources are shared between countries or tribes.
Refugees: Because of the shortage of water and potential famine, people are forced to leave their home and often country to try and find food and water.
Desertification: A shortage of water can cause the land to start to degrade. Eventually this may lead to desertification (the land turning to desert).
Economic Loss: If a country is having to support refugees while at the same time seeing a decline in its exports (primary agricultural products) then the economy may decline.
Dependency: It is often poor countries that suffer from drought and it is these countries that find it hardest to cope, so often become dependent upon charities and international aid.
Education: As people suffer from undernourishment they often become weaker and are unable to teach and or go to school. Also during times of drought people (students and teachers) have to walk further to find water. All of these things would lead to a decline in the quality and quantity of education.
Source: http://greenfieldgeography.wikispaces.com/Droughts
Source: http://www.climatechange-foodsecurity.org/uploads/drought_disasters_.png


Source: http://www.slideshare.net/AllahDadKhan/drought-management-culture-of-pakistan-by-mr-allah-dad-khan-agriculture-expert-kpk-pakistan
HUMAN CAUSES
- Deforestation: Cutting down trees which not only means the land will be receiving less nutrients and be less stable, but it can also mean reduced transpiration rates and reduced rainfall.
- Overpopulation: As the world population continues to grow (now about 7 billion) the demand for water, for domestic use increases.
- Industrial and Agricultural Demand: As the world's population grows bigger, more food is needed and more commodities demanded. Both of these increase the demand for water.
- Economic Development: As countries develop and individuals get richer, they tend to use more water e.g. showers, toilets, gardens, cars, etc.
PHYSICAL CAUSES
- Rising Temperatures: As global temperatures increase more water is needed to grow crops and more water is lost through evaporation.
- Falling Rainfall: The reduction in rainfall significantly reduces the supply of available water.
Source: http://greenfieldgeography.wikispaces.com/Droughts
Human-induced hazard - Fukushima
Beginning on March 11, 2011 the Fukushima NPP lost power due to a magnitude 9.0 earthquake and tsunami and lost capacity to operate emergency cooling systems to remove heat from the reactors and spent fuel pools at the site. Fuel meltdowns and redox reactions between water and fuel cladding at elevated temperatures led to venting and massive oxy-hydrogen gas explosions which seriously damaged units 1, 2, 3 and 4. Significant releases of radionuclides to the atmosphere and directly to the coastal ocean occurred.

Source: http://www.dailykos.com/story/2014/11/21/1346593/-Comparing-the-Environmental-Impacts-fo-the-Chernobyl-and-Fukushima-Disasters
Source: http://www.globalresearch.ca/fukushima-a-nuclear-war-without-a-war-the-unspoken-crisis-of-worldwide-nuclear-radiation/28870
A map of citizens’ measured radiation levels
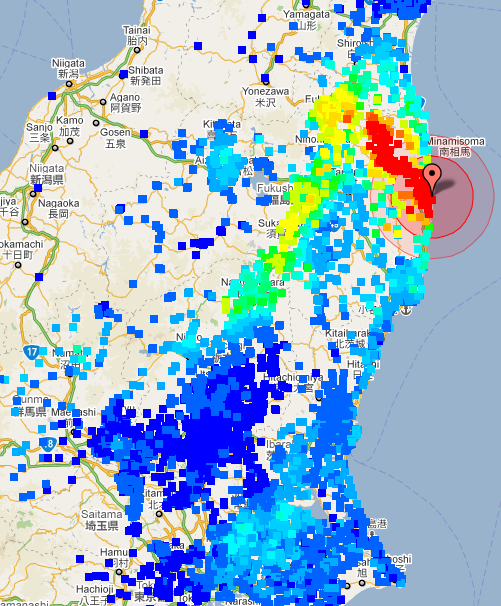
Source: http://www.globalresearch.ca/fukushima-a-nuclear-war-without-a-war-the-unspoken-crisis-of-worldwide-nuclear-radiation/28870

https://noorslist.wordpress.com/2011/06/25/fukushima-nuclear-disaster-and-effects-of-radiation/
No comments:
Post a Comment