Changing patterns of energy consumption
Global patterns and trends in the production of oil

Source: https://en.wikipedia.org/wiki/List_of_countries_by_oil_production#/media/File:Countries_by_Oil_Production_in_2013.svg
Top oil-producing countries, million bbl/day

Source: https://en.wikipedia.org/wiki/List_of_countries_by_oil_production#/media/File:Top_Oil_Producing_Counties.png
Global patterns and trends in the consumption of oil
A map of world oil consumption in barrels a day per capita, 2007. > 0.07 0.07 - 0.05 0.05 - 0.035 0.035 - 0.025 0.025 - 0.02 0.02 - 0.015 0.015 - 0.01 0.01 - 0.005 0.005 - 0.0015 < 0.0015

Source: https://en.wikipedia.org/wiki/List_of_countries_by_oil_consumption#/media/File:OilConsumptionpercapita.png
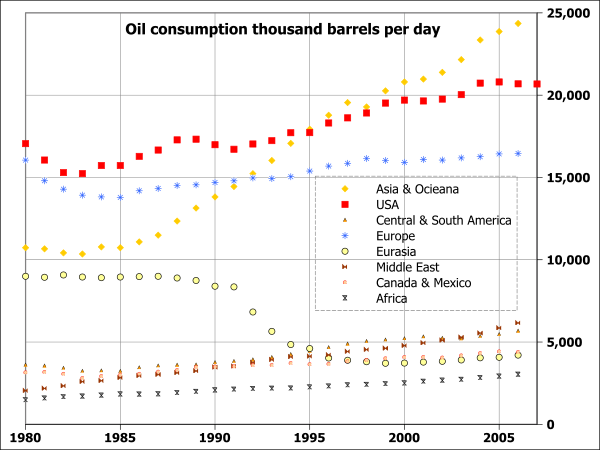
Source: https://en.wikipedia.org/wiki/List_of_countries_by_oil_consumption#/media/File:World_oil_consumption_1980_to_2007_by_region.svg
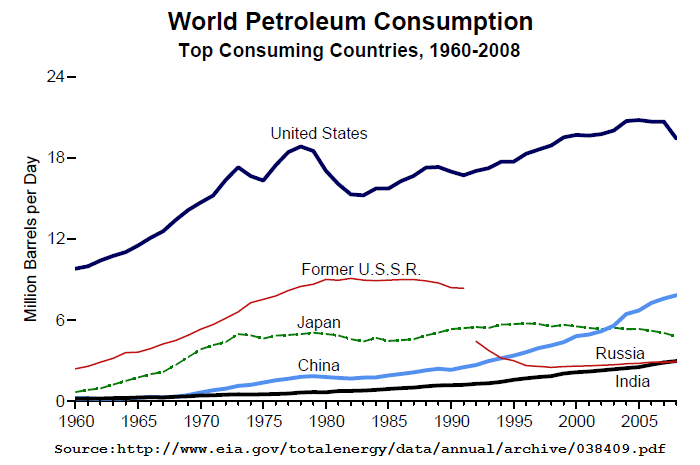
Source: https://en.wikipedia.org/wiki/List_of_countries_by_oil_consumption#/media/File:EIA_petroleum_consumption_of_selected_nations_1960-2008.png
Peak Oil

Source: http://www.treehugger.com/corporate-responsibility/peak-oil-in-2012-saudi-arabias-oil-overestimated-by-40-wikileaks-reveals.html

Source: http://peakoiltas.org/category/about/basics/
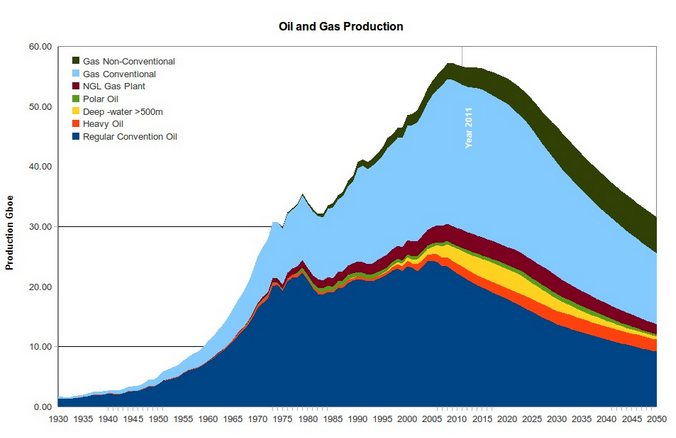
Source: http://peakoilbarrel.com/what-is-peak-oil/
Geopolitical impacts of the changing patterns and trends in oil production and consumption
International relations: If your country depends on foreign imports of oil, it is very important that you are able to maintain good relations. This is not always possible as highlighted by the relationship between the US and Venezuela.Emissions quotas: International agreements like Kyoto are setting greenhouse gas emission quotas. Individual regions like the EU and the UK are also setting targets. With targets to meet more countries are looking to invest in alternatives (renewable energy that pollutes less).
Carbon tax: If carbon taxes are introduced it will greatly increase the value of oil products, making alternatives relatively cheaper and more attractive.
NGO pressure: NGOs are becoming increasingly vocal in their fight against fossil fuels and promotion of greener alternatives. As more consumers listen to NGOs, governments and energy companies are likely to find alternatives.
Source: http://greenfieldgeography.wikispaces.com/Changing+patterns+of+energy+consumption
Environmental impacts of the changing patterns and trends in oil production and consumption
Greenhouse effect and global warming: Fossil fuels are all major contributors to the greenhouse effect. To try and reduce the effects of global warming, many countries are trying to reduce their dependency on oil.
Oil spills: When large quantities of oil are transported by sea or pipeline, there is always the risk of accidents. The Exxon Valdez spill in 1989 is one of the most tragic examples of the short and long-term damage an oil spill can cause. The more recent BP oil spill in the Gulf of Mexico is a more recent example.
Damaged caused by extraction: The recent BP oil spill in the Gulf of Mexico is just one example of how extraction can lead to environmental damage. The Niger delta in Nigeria has also seen large-scale environmental damage caused by extraction.
Source: http://greenfieldgeography.wikispaces.com/Changing+patterns+of+energy+consumption
The changing importance of other energy sources
Solar power
Even yearly energy potential from sunshine dwarfs total energy potential from any other source.
The annual energy potential from solar energy is 23,000 TWy. Energy potential from total recoverable reserves of coal is 900 TWy. For petroleum, it’s 240 TWy; and for natural gas, it’s 215 TWy. Wind energy’s yearly energy potential is 25–70 TWy.

Approximately 66% of installed world solar PV power capacity has been installed in the past 2½ years.
Furthermore, total installed capacity is projected to double in the coming 2½ years.

Global solar PV power capacity grew from about 2.2 GW in 2002 to 100 GW in 2012.
From 2007 to 2012, it grew 10 times over, from 10 GW to 100 GW.

Germany accounted for nearly one third of global solar PV capacity at the end of 2012.
Italy (16%) and Germany (32%) combined accounted for nearly half of global solar PV capacity.

The price of solar PV panels dropped about 100 times over from 1977 to 2012.
Since 2008, the price of solar PV panels has dropped about 80%.

Source: http://www.abb-conversations.com/2013/12/7-impressive-solar-energy-facts-charts/
Wind power
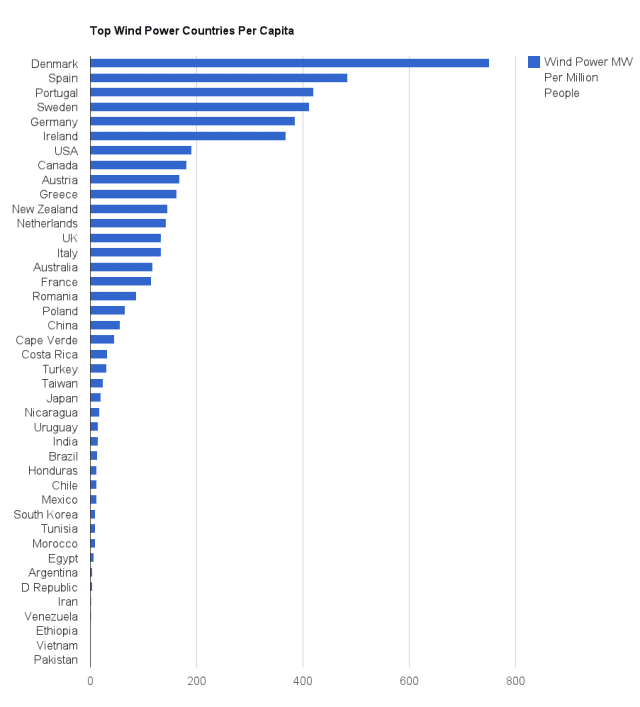
Source: http://reneweconomy.com.au/2013/top-wind-power-countries-in-the-world-per-capita-72534
Data from 2012.
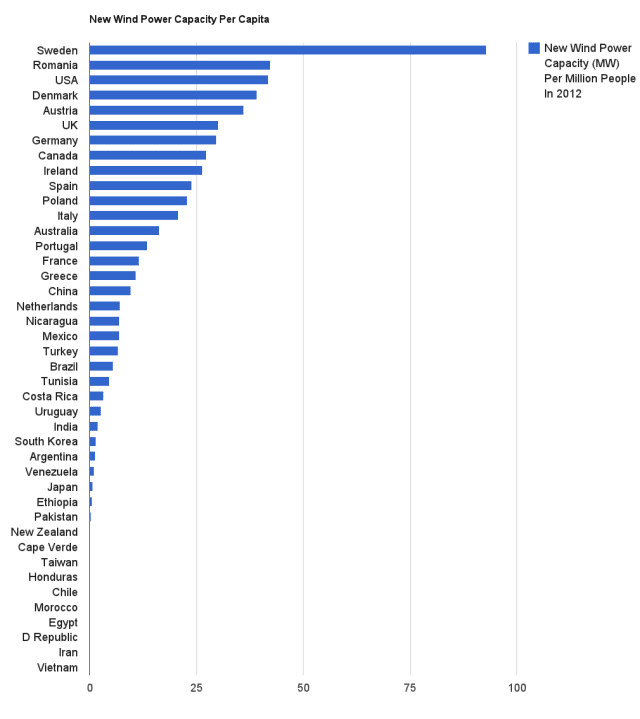
Source: http://reneweconomy.com.au/2013/top-wind-power-countries-in-the-world-per-capita-72534
Data from 2012.
Follow the link below for the Global wind report annual market update:
| WIND: Using the wind to move a wind turbine to drive a generator and create electricity. |
|
|
Tidal power
Estimate of global potential tidal resources

Source: http://tidalenergytoday.com/2015/02/17/estimate-of-global-potential-tidal-resources/
| TIDAL: Using the motion of incoming and outgoing tide to create energy |
|
|
Nuclear
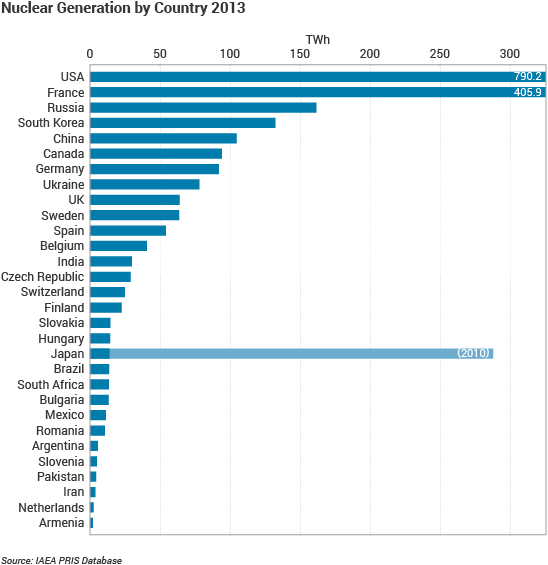
Source: http://www.world-nuclear.org/information-library/nuclear-fuel-cycle/introduction/what-is-uranium-how-does-it-work.aspx

Source: http://worldknowing.com/top-10-largest-nuclear-power-producing-countries-in-the-world/

Source: http://www.carbonbrief.org/mapped-the-worlds-top-countries-for-nuclear-power
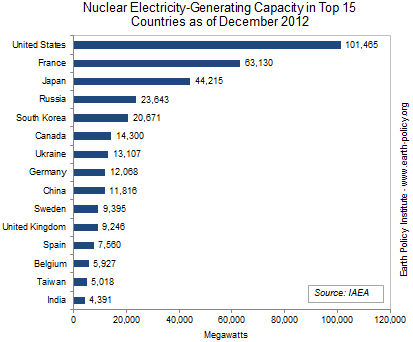
Source: https://www.thinglink.com/scene/633481652298842114
Hydroelectric power
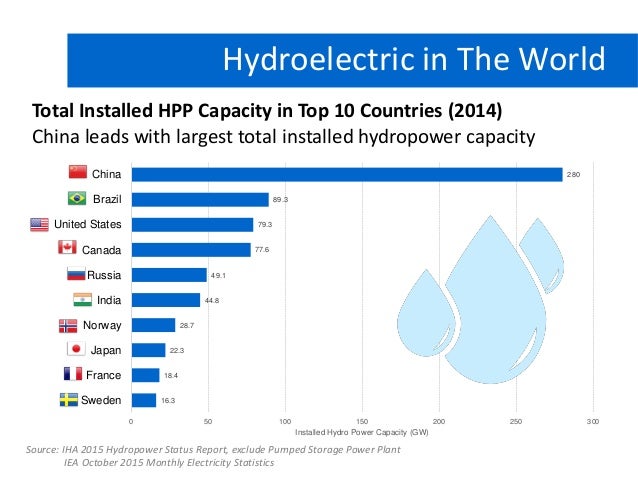

Source: http://www.slideshare.net/RyanTriadhitama/ryan-triadhitama-hydro-present-r01

Source: https://en.wikipedia.org/wiki/Hydroelectricity#/media/File:Top_5_Hydropower-Producing_Countries.png
| HEP (Hydroelectric power): Using the power of falling water in rivers to drive generators. At the moment dams have to be built to create HEP power. |
|
|

No comments:
Post a Comment