
Disasters
Definition
Defining the difference between a hazard event and a disaster is extremely tricky. Below are two definitions, one from the UN and one from the IB. The UN definition is slightly clearer because it applies figures to number of deaths and the number of people affected. The IB definition is much more subjective. However, stating that 10 people have to die for a hazard event to become a disaster seems to diminish the importance of just one death, which in reality is a disaster for the friends and family who loved the victim.
IB Definitions
Disaster: A major hazard event that causes widespread disruption to a community or region that the affected community is unable to deal with adequately without outside help.
Hazard: A threat (whether natural or human) that has the potential to cause loss of life, injury, property damage, socio-economic disruption or environmental degradation.
Hazard event: The occurrence (realisation) of a hazard, the effects of which change demographic, economic and/or environmental conditions.
Remember a natural hazard is only a hazard if it is a threat to humans or there property, so if no humans are endangered and no property is damaged it is just a natural process or event e.g. an avalanche on an Antarctic mountain where no one lives.
UN Definition
"A disaster is a sudden, calamitous event that causes serious disruption of the functioning of a community or a society causing widespread human, material, economic and/or environmental issues which exceed the ability of the affected community or society to cope using its own level of resources".
For a disaster to be entered into the database of the UN's ISDR (International Strategy for Disaster Reduction), at least one of the following criteria must be met:
A report of 10 or more people killed
A report of 100 people affected
A declaration of a state of emergency by the relevant government
A request by the national government for international assistance
Source: http://greenfieldgeography.wikispaces.com/Definition
Measuring disasters
Earthquakes
The Mercalli Intensity Scale was developed by Italian volcanologist Giuseppe Mercalli in 1884 and expanded to include 12 degrees of intensity in 1902 by Adolfo Cancani. It was modified again by Harry O. Wood and Frank Neumann in 1931. It is known today as the Modified Mercalli Intensity Scale.
Source: http://www.diffen.com/difference/Mercalli_Scale_vs_Richter_Scale

Source: https://raymondpronk.wordpress.com/2011/03/12/japanese-8-9-richter-scale-earth-quake-shifts-earths-axis-and-giant-tsunami-ocean-wave-moves-japanese-coast-videos/
The Richter Magnitude Scale was developed in 1935 by Charles Richter. It was initially created to study a particular area in California, using the Wood-Anderson torsion seismograph, to compare the size of different earthquakes in the region. He later adapted the scale so that it could measure the size of earthquakes around the globe.
Source: http://www.diffen.com/difference/Mercalli_Scale_vs_Richter_Scale
Source: http://www.sms-tsunami-warning.com/pages/richter-scale#.V4OzfvkrLQA
While the Mercalli scale describes the intensity of an earthquake based on its observed effects, the Richter scale describes the earthquake's magnitude by measuring the seismic waves that cause the earthquake. The two scales have different applications and measurement techniques. The Mercalli scale is linear and the Richter scale is logarithmic. i.e. a magnitude 5 earthquake is ten times as intense as a magnitude 4 earthquake.
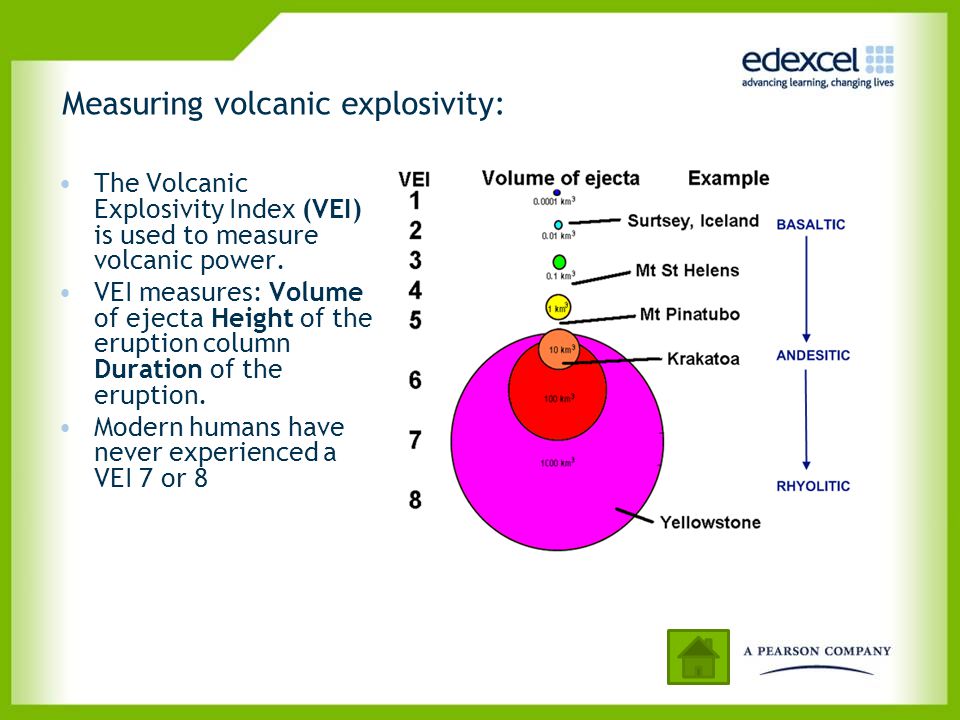
Measuring the strength of a volcanic eruption is more challenging than collecting wind speed data or measuring ground motion with an instrument. Volcanic eruptions produce different types of products, have different durations and develop in different ways. There is also a problem that some eruptions are explosive (rock materials are blasted from the vent), while other eruptions are effusive (molten rock flows from the vent).
Chris Newhall of the United States Geological Survey and Stephen Self of the University of Hawaii developed the Volcanic Explosivity Index (VEI) in 1982. It is a relative scale that enables explosive volcanic eruptions to be compared with one another. It is very valuable because it can be used for both recent eruptions that scientists have witnessed and historic eruptions that happened thousands to millions of years ago.
The primary eruption characteristic used to determine the volcanic explosivity index is the volume of pyroclastic material ejected by the volcano. Pyroclastic material includes volcanic ash, tephra, pyroclastic flows, and other types of ejecta. The height of the eruption column and the duration of the eruption are also considered in assigning a VEI level to an eruption.
Source: http://geology.com/stories/13/volcanic-explosivity-index/
Source: http://slideplayer.com/slide/1695940/
The Saffir-Simpson Hurricane Wind Scale is a 1 to 5 categorization based on the hurricane's intensity at the indicated time. The scale provides examples of the type of damage and impacts in the United States associated with winds of the indicated intensity. The scale does not address the potential for other hurricane-related impacts, such as storm surge, rainfall-induced floods, and tornadoes.

Source: https://www.earlyalert.com/saffir-simpson-scale.html
The Palmer Drought Severity Index (PDSI) uses readily available temperature and precipitation data to estimate relative dryness. It is a standardized index that spans -10 (dry) to +10 (wet). It has been reasonably successful at quantifying long-term drought. As it uses temperature data and a physical water balance model, it can capture the basic effect of global warming on drought through changes in potential evapotranspiration. Monthly PDSI values do not capture droughts on time scales less than about 12 months
Source: https://climatedataguide.ucar.edu/climate-data/palmer-drought-severity-index-pdsi

Source: http://geochange.er.usgs.gov/sw/impacts/biology/fires_drought/
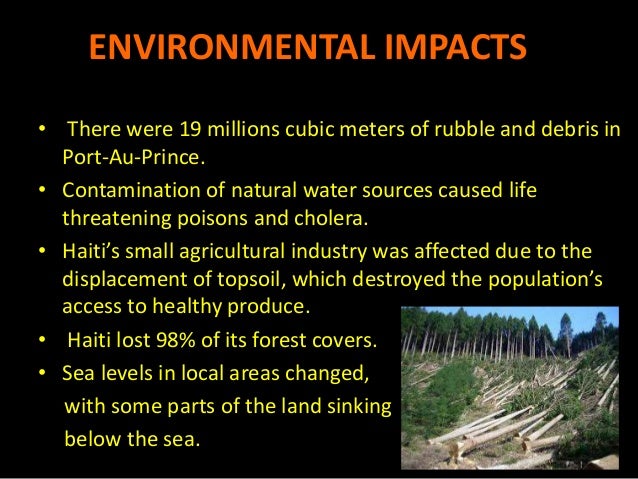
Haiti 2010

Source: http://www.slideshare.net/shiv7C/haiti-earthquake-2010-52771607
What caused the earthquake?
The shaking started on Tuesday, Jan. 12, at 4:53 p.m. ET in the Haiti region, just 10 miles southwest of Port-au-Prince.
The Haiti earthquake occurred at a fault that runs right through Haiti and is situated along the boundary between the Caribbean and North American plates, which are rocky slabs that cover the planet and fit together like a giant jigsaw puzzle. These two plates constantly creep past one another, about 0.8 inches a year, with the Caribbean plate moving eastward with respect to the North American slab.
"Twenty millimeters a year of slippage is very small, and that’s not what people felt," said Carrieann Bedwell, geophysicist with the U.S. Geological Survey (USGS) and the National Earthquake Information Center (NEIC).
Rather, they felt the release of energy from the Enriquillo-Plaintain Garden fault system. "The two sides of the fault line moved past each other in an east-west direction and that's what caused the energy release and the Haiti earthquakes," Bedwell said.
The high magnitude of this quake took scientists by surprise, as this system of faults hasn't triggered a major temblor in recent decades. The fault has, however, been linked to some historical big ones in 1860, 1770, 1761, 1751, 1684, 1673 and 1618, though none of these has been confirmed in the field as associated with this fault, according to the USGS.
Source: http://www.nbcnews.com/id/34842469/ns/technology_and_science-science/t/what-caused-devastating-haiti-earthquake/#.V4O6gfkrLQA


Source: http://www.slideshare.net/shiv7C/haiti-earthquake-2010-52771607
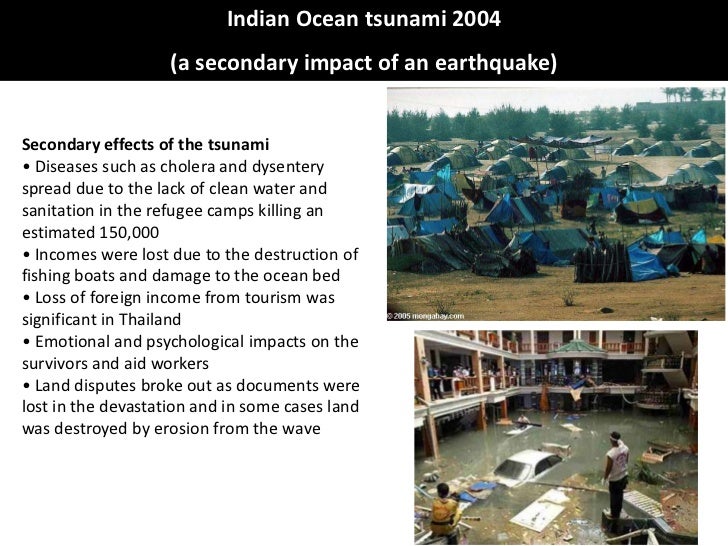
Indian ocean tsunami 2004

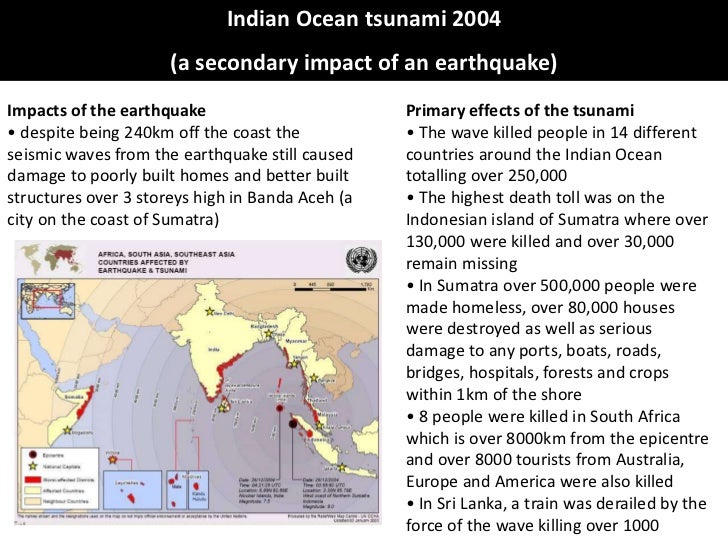
Source: http://www.slideshare.net/PLANETGE0GRAPHY/indian-ocean-tsunami-case-study
Hurricane Katrina v Cyclone Nargis (spatial and developmental impacts)
Sometimes, natural disasters of similar magnitude can have very different impacts depending on the location that they hit. The factors that can affect the impact include:
- Population density
- Time of day
- Level of Preparedness
- Transport and communication
- Level of economic development
Below is a comparison of the impacts of two category five hurricanes; hurricane Katrina that hit New Orleans, US and Cyclone Nargis that hit the Irrawaddy Delta in Burma.
Cyclone Nargis | Hurricane Katrina |
| Dates | Formed: April 27th 2008 Landfall: May 2nd 2008 Dissipated: May 3rd 2008 | Formed: August 23rd 2005 Landfall: August 25th 2005 (South Florida) and August 29th New Orleans Dissipated: August 30th 2005 |
| Location | Cyclone Nargis formed in the middle of the Bay of Bengal. It then tracked west towards India before turning north east and tracking straight to the Irrawaddy delta in Burma. | Hurricane Katrina formed as a tropical depression near the Bahamas. It then tracked west crossing the southern tip of Florida before veering north and hit Louisiana. |
| Magnitude | Category 4 135mph (215kph) Pressure 962 millibars | Category 5 175 mph (280kph) Pressure: 902 millibars |
| Deaths and injuries | 138,366 deaths (many believe the figure was under-reported) 20,000 - 50,000 injured Up to 3.2 million homeless | 1,833 deaths 5,000 treated at emergency triage centre in airport (injured) Estimated 12,000 made homeless in New Orleans |
| Economic Loss from cyclone/hurricane | $10 billion (Nearly 53.5% of GNI based on 2008 figures) Farming sector devastated | $108 billion (0.83% of GNI based on 2005 figures) 70,000 jobs lost (estimate based on unemployment rise) |
| Population | Population: 49.2 million (2008 figures) Population density: Between 70 and 75 per km2 | Population: 296.5 million (2005 figures) Population density: 80 per km2 |
| Population indicators | Life expectancy: 62 Birth rates: 19 Death rates: 10 Fertility rate: 2.2 | Life expectancy: 78 Birth rates: 14 Death rates: 8 Fertility rate: 2 |
| Economic Indicators | Total GNI: $18,676,320,000 GNI per capita: $379.6 % below absolute poverty line of $2: Data not released | Total GNI: $12,912,890,000,000 GNI per capita: $43,551 % below absolute poverty line of $2: 0% |
| Transport and Communications | % of internet users: 0.22% % of telephone users: 1.25% (cell phones and landlines) Motor vehicles per 1000 people: 7 Amount of paved roads: 27,000km | % of internet users: 78.2% % of telephone users: 73% own cell phones (2005) Motor vehicles per 1000 people: 819 Amount of paved roads: 4,148,395 km |
| Education and healthcare | Adult literacy: 84.7% Primary enrollment: 98.5% University enrollment: Data not released Doctors per 1000 of population: 0.36 Healthcare expenditure per capita: $4.5 Infant mortality: 68.78 | Adult literacy: 99% Primary enrollment: 98.5% University enrollment: 72.6% Doctors per 1000 of population: 2.3 Healthcare expenditure per capita: $6,096.2 Infant mortality: 6.81 |
| Aid | Government initially declined aid. First aid flights arrived on 7th May but rescuers found it hard to obtain visas. UK biggest single donor with about $33.5 million. The UN requested a total of $841 million in aid to help victims, but only about $190 million was ever collected from donor countries. | US also delayed asking for international help. Officially they asked the EU for help one week after the disaster. Most relief is in the form of assistance e.g. tents, food, blankets and not money. Cuba did offer to send over 1,500 doctors, but this offer was declined. In total it is estimated $854 million in aid was offered, but up to half was never taken. |
N.B. All data comes from www.nationmaster.com, www.wikipedia.com or http://unstats.un.org. For the US I have used the nearest available data to 2005 and for Myanmar the nearest available data to 2008.
In terms of magnitude Hurricane Katrina (category 5) was actually slightly stronger than Cyclone Nargis (category 4). However, in terms of deaths and damage Cyclone Nargis was actually far more devastating. The information in the table is statistical evidence that helps support some of the reasons below of why Nargis was more devastating than Katrina:
Education: Even though levels of primary enrollment are the same in the US and Myanmar, the overall literacy rates are much higher in the US. It is not only important to be able to read and write so that you can understand the risks posed by hazards and how to minimise the risks, but it is also important that as a population you are educated about hazards by the government. The US local and national government is good at educating its citizens about how to prepare and react to natural disasters. They education people in terms of evacuation plans and also educate rescuers on how to save lives and rescue people.
Transport: Car ownership is much high in the US than Myanmar (over 100 times higher). The US also has a much more extensive road network. In fact in the Irrawaddy Delta where Nargis hit there are virtually no roads and the main form of transport is by boat. The US also has a much bigger air network with established airlines like United, Delta, Continental and American. This means that people in the US were much better able to evacuate the oncoming hurricane and also rescue teams were more easily able to reach victims, thus reducing the overall number of casualties. It also allows water, food, tents, medical supplies to reach affected areas. In times of flooding helicopters are also important - the US who spends more money on its army than any other country in the world has an abundance of helicopters.
Communications: Internet and phone usage is extremely low is Myanmar, where they are both over 70% in the US. Good communications are vital in reducing casualties because it allows people to receive warnings and updates of approaching hazards as well as call for help if they have been impacted by hazards. Again the Irrawaddy Delta is very remote and will probably have even lower internet and phone ownership than the rest of Myanmar.
Healthcare: The US spends a lot more money on its healthcare than Myanmar and has significantly more doctors per person than Myanmar. Therefore it is in a much better position to treat victims of natural disasters and in a better position to reduce many of the secondary hazards like disease common with natural disasters like Nargis and Katrina.
Level of Development: The US is an MEDC and has the largest economy in the world. Myanmar is considered by most to still to be an LEDC. Because of the US's level of development it has much more money to prepare for natural hazards and a lot of money to recover from them. Countries like Myanmar often become reliant on aid in times of natural disasters - something that they were actually slow to accept.
Aid: Both countries were slow to accept aid and the US even declined aid including the offer of over 1500 doctors from Cuba. However, Myanmar's delay in accepting aid and actually declining visas to maid aid workers was much more significant because they were much less able to help themselves. By not accepting aid more victims would have died because of their initial injuries and more people would have suffered from secondary hazards like exposure and disease.
Building Design: Most people living in the Irrawaddy Delta are poor farmers and fishermen who nearly all live in temporary structures made out of things like plastic, wood and reeds which are unable to withstand the strong winds and rain associated with cyclones. On the other hand the US has strict guidelines about building regulations and although many buildings did flood in New Orleans most stood up to the winds associated with Katrina.
Defenses: Even though many of the levees protecting New Orleans failed and caused significant flooding, there were actually many other levees and coastal defences that held and reduced the impact of the hurricane. In the flat Irrawaddy Delta there were virtually no defences and even many of the regions natural defenses like mangroves had been removed making the region more vulnerable and increasing the number of victims.
Insurance: Most people and businesses will have insurance in the US. This means that they can afford to live in temporary accommodation if their house has been damaged and afford for totally to be repaired. Businesses can also claim for lost income and repair any damage. This means that people are able to recover much quicker and are less likely to suffer from secondary hazards and future primary hazards. In the Irrawaddy Delta in Myanmar most people would never of heard of insurance, let alone have it, meaning that they have to rebuild their houses from temporary materials and will lose significant income which may lead to secondary hazards like famine, exposure and disease.
So even though the Hurricane Katrina was one of the US's worst ever natural disasters, its impacts were not as great as Cyclone Nargis because of peoples education and the country's transport, communications and healthcare networks as well as the US's higher level of development and more stringent building regulations and defenses.
Source: http://greenfieldgeography.wikispaces.com/Measuring+Disasters
No comments:
Post a Comment