
Risk and risk assessment
Analysis of risk
Defining risk
From the IB syllabus;
“risk is the exposure of people to a hazard event and the probability of that event causing harmful consequences (expected losses in terms of deaths, injuries, property damage, economy and environment)”
In more detail, risk;
“refers to the expected losses from a particular hazard to a specified element at risk in a particular future time period. Loss may be estimated in terms of human lives, or buildings destroyed or in financial terms”
(Cardona,2005; Burton, 1978).
In many cases, people expose themselves to risk because they often underestimate the scientific or statistical probability of hazard events occurring. Thus they continue to live in hazardous environments because of poor risk perception.
Source: https://docs.google.com/presentation/d/1yhHpfA5pCb_WR6Zo4MCFPS1NCSc1Fnbbkwv1JS66Cl8/edit#slide=id.i18
Source: http://greenfieldgeography.wikispaces.com/Analysis+of+risk
RISK of LOSS = Hazard probability - frequency at given magnitude + Valuation of element at risk + Vulnerability – predicted degree of loss to exposed population should a hazard occur
Source: https://docs.google.com/presentation/d/1yhHpfA5pCb_WR6Zo4MCFPS1NCSc1Fnbbkwv1JS66Cl8/edit#slide=id.i18
Hazard event prediction
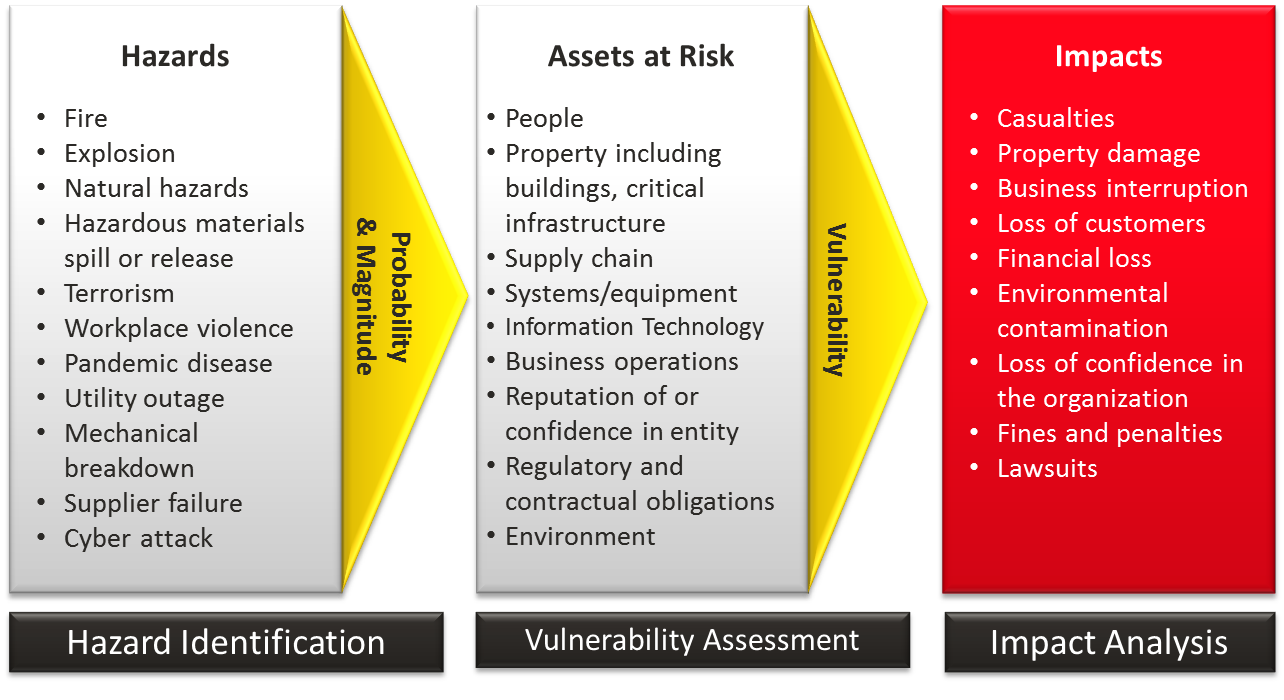
A risk assessment is a process to identify potential hazards and analyze what could happen if a hazard occurs. There are numerous hazards to consider. For each hazard there are many possible scenarios that could unfold depending on timing, magnitude and location of the hazard.
There are many “assets” at risk from hazards. First and foremost, injuries to people should be the first consideration of the risk assessment. Hazard scenarios that could cause significant injuries should be highlighted to ensure that appropriate emergency plans are in place. Many other physical assets may be at risk. These include buildings, information technology, utility systems, machinery, raw materials and finished goods. The potential for environmental impact should also be considered.
As you conduct the risk assessment, look for vulnerabilities—weaknesses—that would make an asset more susceptible to damage from a hazard. Vulnerabilities include deficiencies in building construction, process systems, security, protection systems and loss prevention programs. They contribute to the severity of damage when an incident occurs. For example, a building without a fire sprinkler system could burn to the ground while a building with a properly designed, installed and maintained fire sprinkler system would suffer limited fire damage.
The impacts from hazards can be reduced by investing in mitigation. If there is a potential for significant impacts, then creating a mitigation strategy should be a high priority.
Source: https://www.ready.gov/risk-assessment
Risk assessment: Calculating the likely risk of a hazard happening. People make constant risk assessments all the time e.g. is it safe to cross the road. However, organisations like schools have to make more formal risk assessments. They have to calculate the possible risks of things like school trips e.g. exposure to sun, risk of accident, possibility of drowning. If the risk is deemed too high then the trip can not take place. For example many schools in the UK will now not go on school trips to rivers or the coast because of the risks involved. More formal risk assessments have to be carried out on paper, often on set proforma.
Source: http://greenfieldgeography.wikispaces.com/Analysis+of+risk

Risk assessments usually look at a number of variables, including:
- Potential Hazard: Looks at the potential hazards, for a country this might be natural hazards like earthquakes and hurricanes, for a school it might be hazards like sun stroke, traffic accidents or getting lost.
- Likelihood of Hazard: Look at the frequency of the hazard happening. Again for a country this might how frequent floods happen or for a school the chances of someone running into a road or tripping down some stairs
- Likely Impact: What problems the hazard will cause. This might be damage to property, death and injury for a tsunami or cuts and bruises for falling down stairs.
- People at Risk: Who will be affected. Will it be a whole country or just an individual e.g. a drought might affect a whole country, but getting lost might be just one person.
- Mitigation: How the threat of the hazard can be reduced e.g. building defenses to protect from floods or warning students to wear hats and use sunscreen.
Scores are often applied to the potential of the hazard, its likelihood and impact. If the score of the potential hazard is too high, then the risk will not be taken. Below is an example of half complete risk assessment. The risk assessment is looking at the potential hazards on a school trip. In the attached risk assessment, if the risk is over 10 then the hazard must be avoided.
Likely Impacts
There are numerous factors that need to be looked at, when individuals, communities, countries and organisations are assessing the likely impacts of hazard events. These factors include:
Frequency and magnitude of hazard: Obviously if an areas suffers from strong hazards and if the hazards are frequent and varied in nature then the impacts are likely to be greater. For example countries like El Salvador are hazard hotspots and can suffer from hazards like hurricanes, volcanoes, earthquakes, floods and landslides all at the same time. The greater the number and magnitude of hazards the the greater the impacts.
Defences: If a community or country is well defended e.g. levees or sea walls then the impacts of the hazard is likely to be less, unless the magnitude of the hazard is greater than what the defences are designed for e.g. Hurricane Katrina in New Orleans and the tsunami in Japan (2011).
Prediction/Warning and Evacuation: Countries like the US that have good prediction technology and are able to warn there populations of upcoming hazards are likely to experience smaller impacts. As well as prediction and warnings it is also important that citizens are trained in evacuation and there are evacuation routes in place.
Building design: Countries with good building codes and enforced building codes are going to suffer lesser impacts from hazards. Japan and California in the US have very strict enforced codes which mean most buildings withstand even the strongest quakes.
Hazard Mapping: Countries that have comprehensive, accurate and enforced hazard mapping are likely to suffer less from the impacts of hazards e.g. Wellington in New Zealand and San Fransisco in California. Areas that don't hazard map and have large numbers of people living on marginal land are likely to suffer greater impacts from hazards because there are more people living in vulnerable areas e.g. Medellin in Columbia.
Topography and Geology: Areas that are relatively flat and are situated on solid bedrock tend to suffer less impacts from hazards. However areas that are hilly are much more vulnerable to secondary hazards like landslides and areas on unstable bedrock or even alluvial deposits like Christchurch are going to be vulnerable to processes like liquefaction and suffer greater impacts.
Transport and communications: Countries that have good communication e.g. mobile networks and the internet can better warn there population of impending hazards are less likely to suffer severe impacts from hazards because their populations can prepare. As well as good communications it is also necessary to have good transport links so populations can escape prior to hazards and rescuers can get in after hazards has happened.
Medical services: Countries with good medical care are going to suffer less impacts because they can treat the injured and reduce secondary hazards like disease. In countries like Haiti where medical care is limited, just as many people died from the secondary hazard of disease greatly increasing the impact of hazards.
Education: In countries with high literacy rates people tend to have a better understanding of the potential hazards the region may suffer from and also have a better understanding of how to prepare for hazard and how to react after one. All these things help reduce the impacts of hazards. In countries with poor education people may not even know that they are vulnerable to hazards and therefore the impacts are much greater.
Emergency services: In countries with rescue teams and good emergency services (police, ambulance and fire) the impacts of hazards are likely to be reduced. Not only can they rescue victims, but they can also help keep calm and distribute aid to the needy.
Money and Insurance: Areas that are relatively affluent are better able to prepare for hazards and recover after hazards. In addition individuals with insurance are better able to recover from hazards. Both these reduce the impacts of secondary hazards and the impacts of future primary hazards.
Vulnerability and likely impacts may be mapped by GIS (geographical information systems). GIS simply refers to the collection, storage, presentation, manipulation, analyse and management of geographical information. The data/information is shown spatially so is normally overlaid on a base map. The GIS map below has used different information e.g. geology, altitude, topography, building design, defences, etc. to create a hazard map.
Source: http://greenfieldgeography.wikispaces.com/Analysis+of+risk
Disaster Reduction Index (DRI): Estimates the risk of loss of life that might occur from a hazard event, ignoring the possible damage to livelihoods and the economyMethods of hazard estimation
Disaster Deficit Index (DDI): Models consequences of a hazard event in macro-economic and financial terms, representing maximum probable loss over determined period of time and capacity of country to deal with it
Source: https://quizlet.com/135129789/geography-hazards-disasters-risk-assessment-response-flash-cards/

Source: http://www.iadb.org/en/news/webstories/2010-09-30/idb-natural-disaster-risks-in-latin-america-and-caribbean,8017.html
Local Disasters Index (LDI): Measures risk of social and environmental problems resulting from regular hazard events at the local scale, especially those which have the greatest impact on the poorest groups
Source: https://quizlet.com/135129789/geography-hazards-disasters-risk-assessment-response-flash-cards/

Source: http://www.iadb.org/en/news/webstories/2010-09-30/idb-natural-disaster-risks-in-latin-america-and-caribbean,8017.html
Prevalent Vulnerability Index (PVI): Composite indicator of vulnerability to risk hazards based on Indicator of Exposure and Susceptibility (PVI es), Indicator of Socio- Economic Fragility (PVI sf), and the Indicator of (Lack of) Resilience (PVI lr)
Source: https://quizlet.com/135129789/geography-hazards-disasters-risk-assessment-response-flash-cards/

Source: http://www.iadb.org/en/news/webstories/2010-09-30/idb-natural-disaster-risks-in-latin-america-and-caribbean,8017.html
Risk Management Index (RMI): Estimates effectiveness of risk management in terms of institutional organization, capacity, and development to reduce losses
Source: https://quizlet.com/135129789/geography-hazards-disasters-risk-assessment-response-flash-cards/

Source: http://www.iadb.org/en/news/webstories/2010-09-30/idb-natural-disaster-risks-in-latin-america-and-caribbean,8017.html
Earthquakes
Of all the world's major natural hazards, earthquakes are probably the hardest to predict. Unlike most hazards there is no build up of magnitude e.g. droughts and floods (they tend to get progressively worse, whereas the strongest part of the earthquake is normally the first quake), there are no warning signs e.g. volcanoes (changes in shape, heat, etc.) and the hazard does not move towards land e.g. hurricanes and even tsunamis (so you can prepare for its arrival).
Even though it is still impossible to predict the exact location, strength and time of an earthquake, seismologists have made some advances in predicting earthquakes. Below are some of the advances seismologists have used and some of the methods that they use to try and aid prediction.
Foreshocks: An increase in the frequency of small earthquakes (foreshocks) have been used to predict large earthquakes. Probably the most famous example was the prediction of the 1975 Haicheng earthquake which measured 7.2 on the Richter scale. However, only about 5% of foreshocks lead to bigger earthquakes so there can be a lot of false alarms.
Seismic History: Seismologists can study the seismic history of earthquakes and try and make predictions of when future earthquakes are likely to happen. For example El Salvador has a major earthquake roughly once every ten to twenty years. However, at best this can only give a rough time frame and can certainly not pinpoint the time or location of an earthquake.
Animal behaviour: Some scientists believe that small animals e.g. cats, toads and dogs are able to detect pre-seismic activity and alert people to an imminent earthquake. Some scientists believe that it is low frequency electromagnetic signals that they are responding to. It is believed that toads en mass hopping across the road in Taizhou, China two days before a major earthquake that killed 10,000 people was actually a warning sign that local authorities should have acted upon.
Plate boundaries: Most earthquakes are found along plate boundaries so scientists can alert countries and populations to the risk of earthquakes. However, even knowing the potential location certainly does not help predicting the time of a quake. Also some earthquakes happen along old and unknown plate boundaries and faults or actually happen with plate boundaries e.g. intraplate earthquakes. Because these earthquakes are almost impossible to predict that they can cause a lot of damage because populations are not prepared.
Radon: The release of radon has been studied as a precursor to a major earthquake. However, all studies have proved inconclusive, but what scientist claimed that he did predict the recent L'Aquila earthquake in Italy using this technique.
Geological Changes: Scientists believe that small-scale uplift, tilt or subsidence of the ground can be precursor to major earthquakes. However, it would be almost impossible to try and monitor all geological changes around the world to try and predict earthquakes.
Rock stress: Scientists also believe that changes in the stress of rocks can also be a sign of imminent earthquakes. Some research done along the San Andres fault suggested changes in rock stress 2 hours before an earthquake. Again though it would be almost impossible to monitor all plate boundaries look for changes in stress.
Source: http://greenfieldgeography.wikispaces.com/Hazard+event+prediction
Tsunami
Tsunamis are a secondary hazard that can be caused by one of the following primary hazards:
Earthquake
Submarine volcano
Mass movement
Meteor
Therefore a lot of tsunami predictions can be made by monitoring the primary hazards that cause tsunamis. Astronomers study the sky for potential meteors and can make predictions about their impact, seismologists can record earthquakes and vulcanologist study potential volcanoes. However, monitoring primary hazards is not the only method used of predicting tsunamis. The Pacific Ocean and now the Indian Ocean have very sensitive and sophisticated tsunami warning systems. It must be noted that the method below is not a prediction, but a warning after a tsunami has been triggered.
Tsunami warning systems consist of two important components; one a network of sensors and two a communications infrastructure. A tsunami warning is often triggered by seismic gauges monitoring for earthquakes (most common cause of tsunamis), but then onshore tidal or offshore buoys measure for changes in sea height/tide etc. to confirm the presence of a tsunami. At sea tsunamis maybe not noticeable to humans because it is not until they reach shallower water near the coast so they develop into their devastating size. Once the presence of a tsunami has been confirmed, the second component of the system is essential - communications. All vulnerable populations must be alerted via television, internet, radio, texts, twitter, sirens, etc. Without proper communication to vulnerable populations, knowledge of a tsunami is useless. It is also important that vulnerable communications have plans to how to evacuate and protect populations.
However, it must be remembered that if an earthquake happens very close to land and a tsunami is triggered any warning can be too late to evacuate communities. It was estimated that Bandah Aceh (Northern Sumatra, Indonesia) was hit within 15 minutes of the 26th December 2004 earthquake. Therefore even if there was a warning system in place, evacuation would not have been possible.
Evacuations Based on Predictions
Despite improvements in predictions, evacuation warnings are not always made or made very late. Some of the reasons for the delay in evacuation notices include:
- Governments don't want to cause panic. A panic may cause more deaths than the hazard.
- The cost of ordering an evacuation (both in physically moving people and closed businesses)
- Unpredictable warnings. People may actually be evacuated into a more dangerous area.
- Late predictions. If a warning comes late it maybe safer for people to stay in their homes, rather than attempting to move away.
- Some old, young and sick people are unable to travel
- Some people don't hear evacuation warnings or can't afford to evacuate (no car, no where to go, etc.)
- Some people don't want to leave their home, business, pets, etc. unattended
- People believe they are safe in their homes and can defend against the hazard.
Source: http://greenfieldgeography.wikispaces.com/Hazard+event+prediction
No comments:
Post a Comment